Social Icons

Pages

Friday, February 8, 2013

Textbook 9.2: Patterns in a Table of Values (14, 16, 18) Scribepost.

The algebra post that contains the questions that may or may not turn your brain into mush.


14. b) Let f = Figures
Let s = Squares

 3f + 1.

14. c) 61 squares (20 x 3 + 1 = 61)

14. d) 30 squares
Figure 10: 10 x 3 + 1 = 31.
So: 61 - 31 = 30.


Let h = Height (m)
Let t = Temperature (C)

16. c) Since the h and t values are consistent, then yes, the ordered pairs are linear as the graph shows.

16. d) 1050 metres.


Let r = Rental Cost
Let p = People

18. c) r ÷ 5

Wow, that actually wasn't hard.

Thursday, February 7, 2013

Graphing Algerbra 9.2

Good evening 8-14 :)


 This is what my notebook looked like....


The same thing happened when we did horizontal except it was 2S=H
 
Also with diagonal but 4S=D


Have a good night:)

Wednesday, February 6, 2013

Graphing: Textbook Page 340

A) 
 
B) The pattern is that ever 100 quantity, it would cost you 75 dollars, so you just keep adding 75.
 
C) half of 75 is 50, so If the quantity is 350 it would be 225, which is 225 plus the 50 which is 37.5 so that should add up to 242.5
 
D)242.5
E) Its the same thing
 
A) 
B) For every 2 boxes of almonds you make a 1 dollar profit. Divide
the boxes of almonds by two then you will get the profit. In the boxes of almonds you add by two and profit you add by 1.
C) The School makes a 1 dollar profit.
 
D)Its basicly the same thing as number C, but turned around.


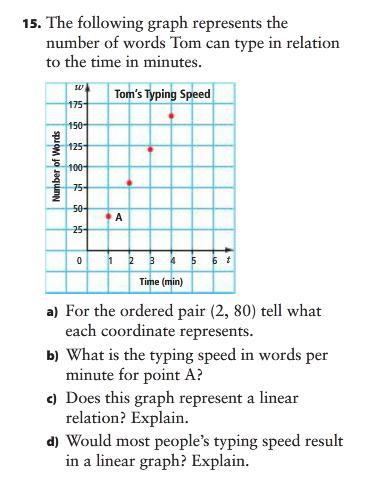
A) It means that tome can type 80 words in 2 minutes.
B) 40 words per minute.
C) Yes because if you connect the dots, it will be a line.
D) NO because your typing speed can be different each time.


Jessie's Linear Relation Scribe Post

6. Tessa and Vince go shopping at Bulk Bin. The graph shows the cost of banana chips. 


A) Describe patterns shown on this graph.
B) Make a table of values from the graph.
C) Is it responsible to include a point on the graph that shows the cost of 250 g of banana chips? Explain

A) For every 100 Grams, it costs 60 cents. This graph is linear because it follows a pattern and the dots follow a straight line.

B)  g | 100  200  300  400  
cents|  60   120  180  240

C) Yes, because 250 g will cost 150 cents or $1.50

7)


A) For every cube, there are 2 cm added.
B) C| 1  2  3  
 Cm|  2  4  6

C) No, because the cubes cannot be halved.

8)


A) x | 1  2  3  
     y | 2  4  6

B) x | 1   2   3   4   5   6   7   8   9   
      y | 2   4   6   8  10 12 14  16  18

C) For every unit on the x axis, the y axis increases by 2.

D) If the value of the x axis is 9, then the value of the y axis will be 18.


9)


A)  H | 1    2    3    4    5
      $  | 15  30  45  60  75

B) The hourly pay is $15/h

C) Yes, because 3.5 hours equals $52.50


Graphing: Textbook Page 338

How to deal with those pesky little graphs:

10.
a) Yes, you can. You can buy 2 flowers.
b) There would be one on 2, because you can buy that amount


11.
a)( 60, 2)
b) 60 = $60 invested
      2 = Simple interest
c) The amount invested goes up by 20
The interest multiplied by 20 = amount invested
d) 90. 180 / 20 = 90


12.
a)


b) The functional pattern is the length .cm multiplied by 4
The perimeter cm is adding by 2
c) Yes, you can have a measurement that has a decimal (e.g. 3.5)
d) Yes, it's linear. The graph data is shown in a straight line.


Hey. Click here. It's pre-algebra graphs. (It deals with negative numbers too.) 
Here's a video with a nice lady who'll teach you about graphing
(The video's embed was disabled.)
 

Tuesday, February 5, 2013

Graphing

Show You Know , page 335  A and D
Cost Of Notebooks

A) Describe the patterns you see on the graph
The patterns I see on the graph is that 1 note book cost $2. Then 2 notebooks cost $4 and 3 notebooks cost $6 . etc.

D) Is it possible to have points between the ones on the graph 

Yes it is possible but not necessarily, not in this case because you can't buy half a notebook.


Example on how the graphing works.

Graphing

Today in math we learned about coordinate grids and
 how to label them.


Another form of showing your work: 
Textbook B & C :